Project Overview :
● NumPy is an essential module for carrying out data science operations efficiently.
● NumPy stands for Numerical Python.
Syntax: scipy.stats.linregress()
● scipy.stats.linregress(x, y=None, alternative='two-sided')
Matplotlib: Visualization with Python
● Matplotlib is a comprehensive library for creating static, animated, and interactive visualizations in Python. Matplotlib makes easy things easy and hard things possible. An object-oriented plotting library. A procedural interface is provided by the companion pyplot module, which may be imported directly. Eg: import matplotlib.pyplot as plt
Matplotlib Application Interfaces (APIs)
● Matplotlib has two major application interfaces, or styles of using the library:
● An explicit "Axes" interface that uses methods on a Figure or Axes object to create other Artists, and build a visualization step by step. This has also been called an "object-oriented" interface.
● An implicit "pyplot" interface that keeps track of the last Figure and Axes created, and adds Artists to the object it thinks the user wants.
Requirements :
● Python
● VS code
● Library – numpy,scipy and matplotlib
Code :
import numpy as np
import matplotlib.pyplot as plt
from scipy import stats

x=np.array([0,1,2,3,4,5,6,7,8,9,10])
y=np.array([0,2,4,6,8,10,12,14,16,18,20])

slope, intercept, r, p, std_err = stats.linregress(x, y)
def myfunc(x):
  return slope * x + intercept

mymodel = list(map(myfunc, x))
print("r value: ",r)
print("p value: ",p)
print("std_err: ",std_err)
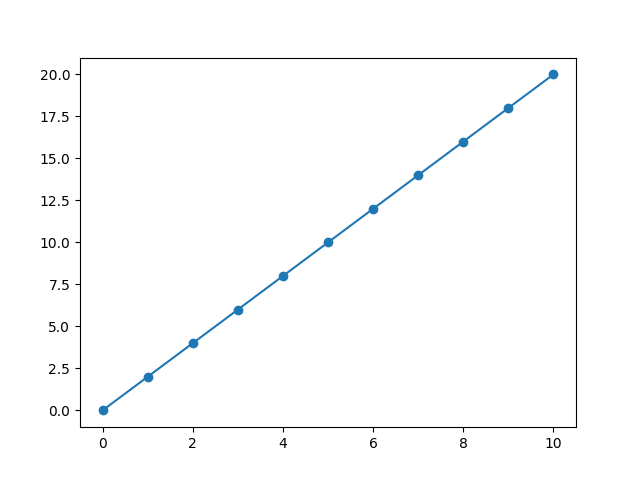
plt.scatter(x, y)
plt.plot(x, mymodel)
plt.show()
Code Explanation :
● import numpy =>import numpy as np and use it in python. In command prompt or VS code terminal run the below pip command to install numpy library,
● pip3 install numpy # For Python version 3
● from scipy import stats -> import scipy and use it in python. In command prompt or VS code terminal run the below pip command to install scipy library,
● pip3 install scipy
● import matplotlib.pyplot as plt import matplotlib and use it in python. In command prompt or VS code terminal run the below pip command to install matplotlib library,
● pip3 install matplotlib
● Here pyplot() is the most important function in matplotlib library, which is used to plot 2D data.
● x=np.array([0,1,2,3,4,5,6,7,8,9,10]) -> Create the array that represent the values of the x
● y=np.array([0,2,4,6,8,10,12,14,16,18,20]) -> Create the array that represent the values of the y axis
● It returns some important key values of linear regression,
● slope, intercept, r, p, std_err = stats.linregress(x, y)
● Declare a function that uses the slope and intercept values to return a new value. This new value represents where on the y-axis the corresponding x value will be placed
def myfunc(x) :
● return slope * x + intercept
● Run the function through each value in the x array. This will produce a completely new array with y-axis values:
● mymodel = list(map(myfunc, x))
● Print the r value, p value and standard error.
● print("r value: ",r)
● print("p value: ",p)
● print("std_err: ",std_err)
● plt.scatter(x, y) -> draw the scatter plot
● plt.plot(x, mymodel) -> draw the linear regression
● plt.show() -> display the plot.
● Run the code.
Output :
● After running the code, output of the terminal as given below,
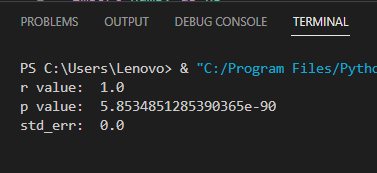
● Graph was generated in the plot.